(6 pt) 1. Use "log-log" paper (given out in class or you can download below) to plot the Periods versus Distances
of at least 6 satellites of Jupiter, Uranus, Neptune, and/or Saturn (choose two different host planets!).
In Space Update, the data can be gotten from selecting "Solar System" and then choosing a planet.
Then click on "Moons" - that will give you a list of moons. Once you click on a moon in the list
of moons, the data will show at the bottom. Use "Orbit Period" (in earth days) for the period T
(y axis). For the X-axis (distance from center of planet) use the "Orbital Distance" field, but note those
numbers are in units of 103 km, so be sure to plot it properly.
Log-log paper basically plots the Log base 10 of the number on each axis, so the markings
go in powers of ten: 0.1, 1, 10, 100, 1000, etc. Each power of ten is called a "cycle".
The log10 (generally just
called "log", as opposed to loge, which is generally written "ln") is the power
of ten that a number would be if you used fractional exponents. So you use scientific
notation without having to write superscripts!
If you multiply numbers, you add the logs; to divide numbers, you subtract the logs.
So, the log of (1.6 x 10⁴ ) = log (1.6) + log (104) = 0.20 + 4 = 4.2
The leading number before the decimal is the power of ten in scientific notation;
and the fraction represents the log of the number between 1 and 10 that goes before the power of ten.
The paper effectively takes the logs for you when you plot the points using the log scale.
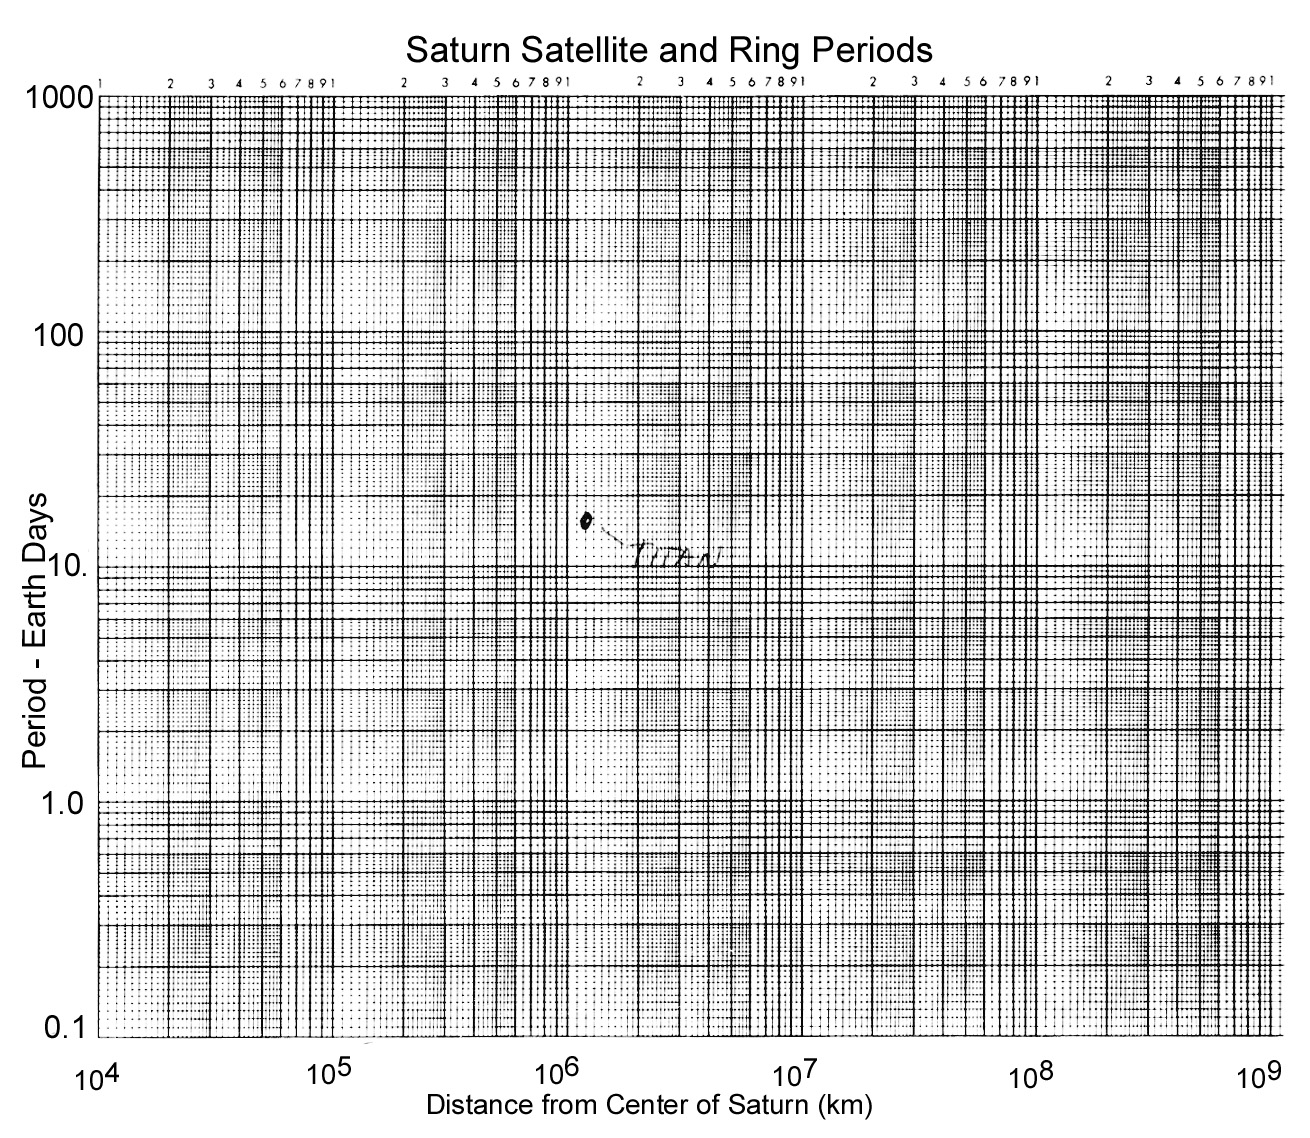
Please use this log-log paper do your plot on. "Titan" for Saturn
is plotted as a sample data point.
PLAN AHEAD - some of the orbits are fractional earth days, so note the lowest y value is 0.1 instead of 1. If you use a satellite list from the book or elsewhere, that's OK, but be sure to label your axes!
Be sure that you have enough "cycles" on the log paper to cover all your selected satellites. Feel free to extend if needed.
Once you have plotted each satellite as a point, see if you can draw a line through the points of all the satellites of a given planet (e.g., one line for all of Uranus's moons, and one line for all of Saturn's moons). Is it a good line (it should be)? If not, go back and check to see if you've used the same units for all points.
Using your line, what's your predicted value of the period for distance = 105 km?
Planet 1 name = ____________ value of T at 105 km = __________
Planet 2 name = ____________ value of T at 105 km= __________
This can be used to find the mass of the host planet. Note the heavier planet has the SMALLER
value at 105 km. The more mass, the more the gravitational force, so the faster the satellite has to move to stay in orbit.
How does the slope of the lines differ between the two planets you chose? __________________
(2 pt) 2. Use the values you estimate at 105 km above to calculate from your data, the ratio of the masses of the two planets you chose. How does this compare to the accepted value? Hint: use Kepler's 3rd law and Newton's Law of Gravitation. What does the value of the intercept correspond to? See the "topics and terms" notes.
Law of Gravitation: F = -GMm/r2
Kepler's third law T2 = K a3
T = Period = 2 pi a / v
So, if r = a, solve for K = ? ________________
here is the value for G but it will divide out so you don't need it...
G = gravitation constant = = 6.67 E-11 (N-m2/kg2)
(see the topics and terms notes)
Last revised: 9/27/2021